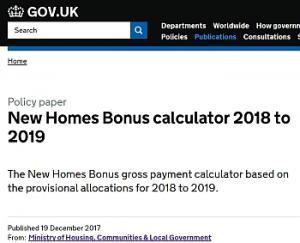
The provisional New Homes Bonus figures released towards the end of December 2017 show the number of long-term empties increasing, bringing to an end the series of year-on-year reductions that had lasted since the NHB was first introduced. As usual, EHN has performed some additional analyses on the data, the full results of which are available to Full Members and Library Subscribers from our Information Library. [You'll need to be logged and have the necessary permissions to access the spreadsheeet, further details of which are described at the end of this story.] What's included in this year's NHB? The April 2017 NHB payment was for five years, the last of which was reduced by the 0.4% baseline that was introduced at short notice as the NHB settlement was announced. The payment due in April 2018 will only include three years of legacy payments - a total of four years. Of these four years, the latest two (2016, 2017) will be subject to the 0.4% baseline reduction, and the earlier two will not. Overall this would indicate a further reduction in the total amount of NHB paid (including legacy payments). This is indeed the case, but relatively strong growth in the overall number of dwellings seems to have staved off some of the worse effects and a number of authorities (over 20% of them) have managed to earn more NHB despite the few number of years being rewarded. Nevertheless, the bottom 30% will receive less than three-quarters of what they were paid in April 2017. Table 1: 2018 Total NHB as a percentage of 2017 Total NHB (including legacy years) Percentiles 2018 vs 2017 NHB 10% 58.9% 20% 66.3% 30% 73.3% 40% 78.8% 50% 85.0% 60% 90.2% 70% 95.7% 80% 103.2% 90% 114.0% Empty Homes The figures for empties returned to use are starting to show the swings-and-roundabout effects that one might expect after most long-term data cleansing has been carried out. The April 2017 payment included reward for an overall reduction across the country of 3,451 long-term empties. By contrast, the figures from the 2017 CTB (for payment April 2018) show an increase in long-term empties of 6,091. Assuming that NHB was to be paid in all authorities (i.e. the 0.4% threshold was exceeded) this would amount to £8,306,745 lost in 2017, and 33,226,979 over the full four years the reward is to be paid. Again percentiles have been calculated for the numbers of empties returned to use. (Negative figures mean the number of empties have gone up). Practitioners will not need reminding that the figures in question have little to do with the activities of empty homes team, the positive effects of which will be known only to themselves and their management hierarchies. The outcomes reported on CTB returns reflect market and administrative factors which also explain the dramatic swings from year to year in the totals for the various authorities. Percentile LTEs returned to use 5% -189 10% -123 20% -80 30% -45 40% -26 50% -12 60% 3 70% 17 80% 46 90% 81 95% 120 Over 50% of authorities saw an increase in the number of long-term empties. Finally - it should be noted that these are provisional figures, subject to correction by the local authority. For more about New Homes Bonus see the extensive treatment in our Practitioner Guide (Full Members and Library Subscribers only). About the New Homes Bonus calculator - EHN version
This is the NHB calculator with provisional figures for 2018-19, payable April 2018 and based on the 2017 CTB returns. This version should work normally as an NHB Calculator but also includes additional analyses and columns provided by EHN. - The total payable in April 2017 is compared with the total in April 2018 and the percentage of the latter over the former is calculated, along with percentiles.
The figures are sorted by the percentage in question in an additional worksheet ('Y8 data % change').
The cumulative figures for each year are shown in the main results table for each individual authority (where you can select your authority from the drop-down)
In addition, the outcomes around long-term empties have been analysed, and presented in two worksheets, one by LA name and one by the number of empties returned to use according to the CTB. These two sheets also include columns that: - plot the change in outcomes between the 2016 and 2017 CTBs
calculate the Band D equivalents returned to use in 2017
using that latter figure, calculate the impact on NHB earned over 1 year and 4 years.
EHN-supplied figures are in dark maroon font.