Find more posts

NHB: Analysis of 2017-18 figures

Latest
December 19, 2016
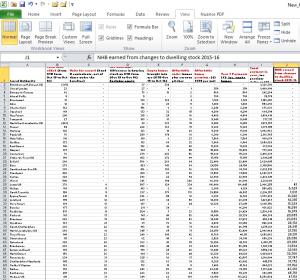
We have analysed the provisional NHB allocations for 2017-18 to try and gauge the impact of the changes in the NHB regime. To do this we have combined the provisional allocations table with more detailed data extracted from the current year's NHB calculator.  The results are contained in an analysis that you can find in our Information Library here. This is for Full Members only so you will need to be logged in to access it. The key things to remember when getting to grips with the figures are:
  • this year authorities are only getting 5 years worth of NHB, not 6 as previously: they are getting the rewards for years 3,4,5,6 and 7
  • the 0.4% baseline has been applied to this year's figures
As noted in last week's news story, the effect of the baseline is quite savage and also creates a wide range of variation in the amounts awarded. For example, if the NHB reward in a given authority is based on a net change in the dwelling stock of +0.5%, the reward will only be paid on the 0.1% over the baseline - 4/5ths of it will be lost compared to what would have happened previously.  If the neighbouring authority has a 20% better outcome - increasing the net dwelling stock by 0.6% instead of 0.5%, its reward will be paid on the 0.2% over the baseline i.e. twice as much as its neighbour. In addition to the reductions due the introduction of the baseline, the bonus earned for Year 7 will only be paid for 4 years not 6. In our analysis (columns M and N) of the worksheet 'By Name' we show what would have been earned in total under the old system compared with what will be earned under the new system, taking both these factors into account. We also plotted the percentile values for some of the columns. These show that 60% of authorities will have earned 40% or less over the 4 years compared with what they would have earned under the old system over 6 years. 40% will earn a third or less. Please note that the columns in the table below are all independent of one another. Per- centile Total reduction due to introduction of baseline: Year 7 payments Net reduction in NHB earned under new system compared with old from 2016 CTB returns New as a % of old - total based on year's return 5%            109,384            812,628 3.4% 10%            135,615         1,102,130 8.3% 20%            179,382         1,447,796 20.6% 30%            205,371         1,803,201 29.6% 40%            231,658         2,100,377 33.0% 50%            267,942         2,439,463 36.3% 60%            324,685         2,884,869 40.2% 70%            402,486         3,636,819 43.2% 80%            555,048         4,576,982 46.9% 90%            686,331         6,958,303 50.3% The other key point to remember is that overall these changes affect single tier authorities very differently from the way they affect districts. The money saved from NHB (£240million) is all being redistributed to the social care authorities - i.e. metropolitan boroughs, London boroughs, other unitaries, and the shires (counties).  So for the single tier authorities money that has been cut from their NHB is coming back in, though not pound-for-pound but based on their relative social care needs.  Of course, districts in two-tier areas get none of this as they do not have social care responsibilities.  These changes reverse the historic impact of NHB, which redistributed money from counties to districts.  Previously, a district which might only receive 10% of the council tax it collected (the rest being passed to the county, the police authority etc) got to keep 80% of the NHB it earned.  As NHB is mainly funded from a top-slice of Revenue Support Grant, that 80% was funded by a disproportionate top-slice from the RSG received by the relevant shire authority. If all this tinkering with NHB seems a bit murky, it is worth reflecting that NHB is a highly political measure, the aim of which is to suggest that somehow it is the local authority planning system that is responsible for a crisis which in reality stems from the abject, long-term, and continuing failure of national government of all political hues to address the housing needs of English households. It is not a rational or adequate response to that crisis.